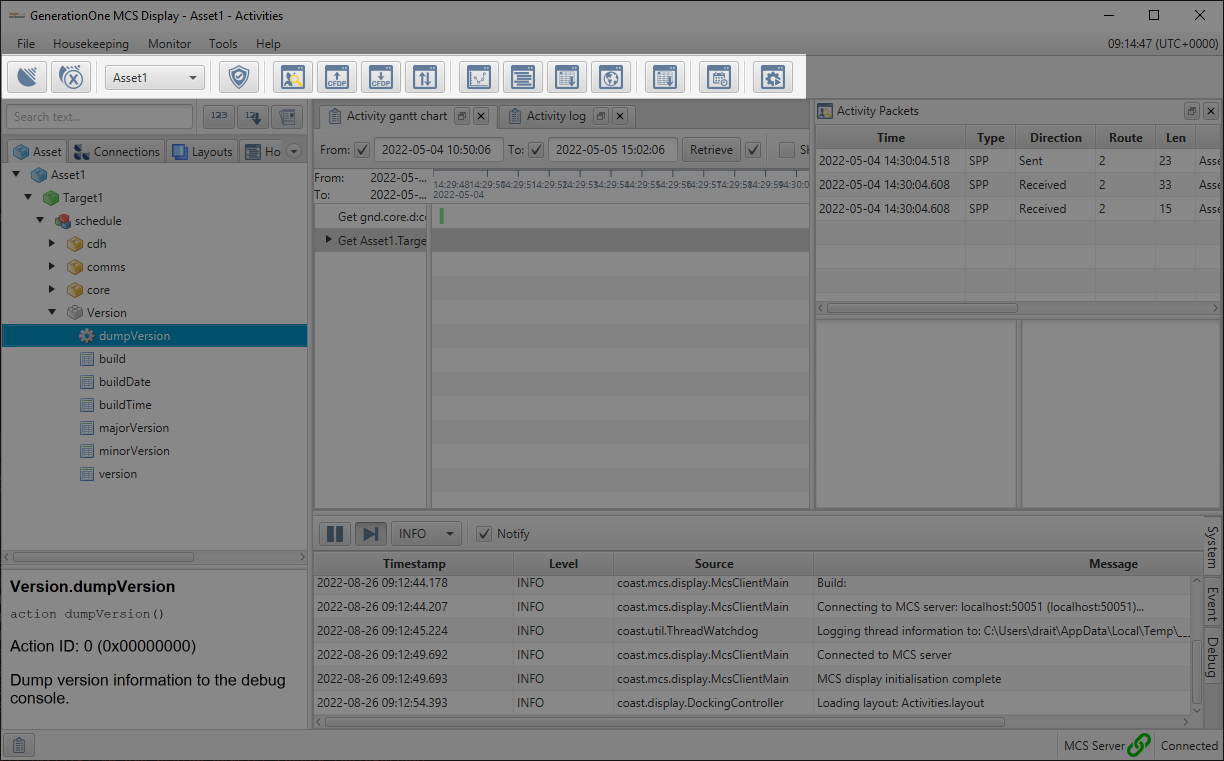
The MCS GUI
MCS provides a GUI for interacting with flight software. This feature guide introduces the core GUI elements and what they are used for.
|
Read the MCS User Manual for further information about the MCS GUI. |
Menu Bar
The menu bar in the upper-left corner of the GUI provides access to key features. It is divided into the following sections:
-
File for general management tasks
-
Housekeeping for managing archives, Assets, and Targets
-
Monitor to observe scheduled Events, script outcomes, and conduct general health checks
-
Tools for additional functionality provided to support ground operations and automation
-
Help for accessing licence information and the splash screen
Toolbar
The toolbar is located below the menu bar and provides access to the core MCS functionality.
The asset dropdown allows you to select an asset to view. Other functions operate in the context of the currently selected asset.
The buttons on the toolbar, provide shortcuts for commonly-used menu items. Most of them provide access to dockable views that allow you to integrate with the spacecraft in various ways.
| Icon | Menu item | Function |
|---|---|---|
|
File → Connect |
Shows the connection dialog |
|
File → Disconnect |
Disconnects all connections to the current asset |
|
Housekeeping → Check housekeeping |
Enables or disables checks for Housekeeping with check violations appearing in the log view |
|
Monitor → Packet monitor |
Displays the packet monitor view |
|
Monitor → CFDP uplink |
Displays the CFDP uplink dialog |
|
Monitor → CFDP downlink |
Displays the CFDP downlink dialog |
|
Monitor → Transfers |
Displays active transfers both downlinks and uplinks |
|
Monitor → Graphs |
Opens a graph view that displays Parameter values in a graph |
|
Monitor → Parameter table |
Opens a Parameter table that shows the last known Parameter value in a table |
|
Monitor → Parameter log |
Opens a Parameter log; a time based view of Parameter values |
|
Monitor → Map |
Displays the map view |
|
Monitor → Event log |
Opens an Event log that shows a time based view of Event details |
|
Monitor → Time-based schedule |
Shows the ground schedule view to administer the MCS's ground schedule |
|
Monitor → Script execution |
Shows the interface for executing preconfigured scripts |


|
Each button on the toolbar comes with a tooltip. Additionally, the toolbar features a drop-down menu for selecting and connecting to different assets. |
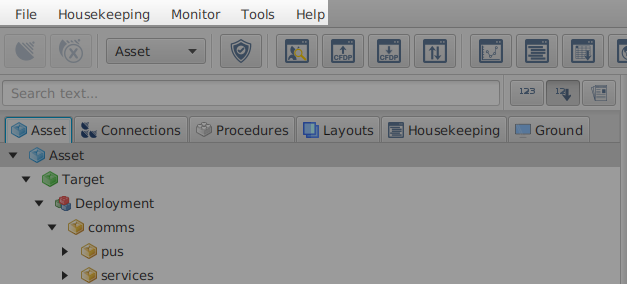
Mission explorer
The leftmost panel of the user interface is the mission explorer. This is a tabbed explorer containing the items associated with the current mission.
The mission explorer allows you to view the Mission's assets, connections, procedures, layouts, and Housekeeping tasks.
The text field above the explorer tabs allows you to search for and navigate to items in the asset Component tree. There are three buttons to the right of the text field:
-
The image::ROOT:show_id_button.png[Show ID Button, width=30px] show ID button toggles the display of numerical identifiers for each item in the Component tree
-
The image::ROOT:sort_id_button.png[Sort ID Button, width=30px] sort ID button organises the items in the Component tree by their numerical identifiers
-
The image::ROOT:show_documentation_button.png[Sort ID Button, width=30px] show documentation button toggles the documentation pane
-
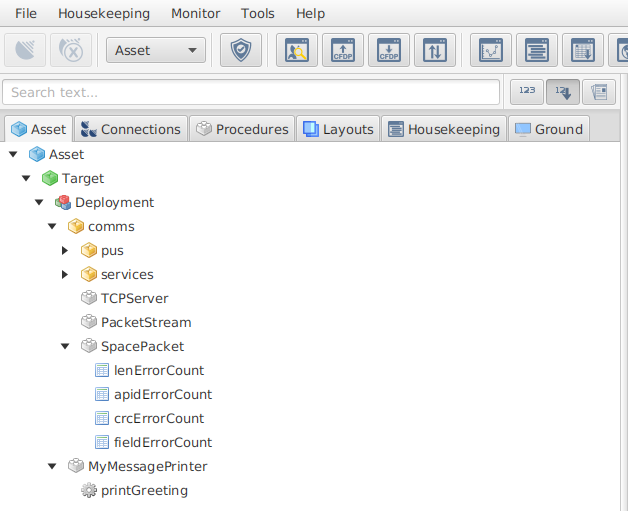
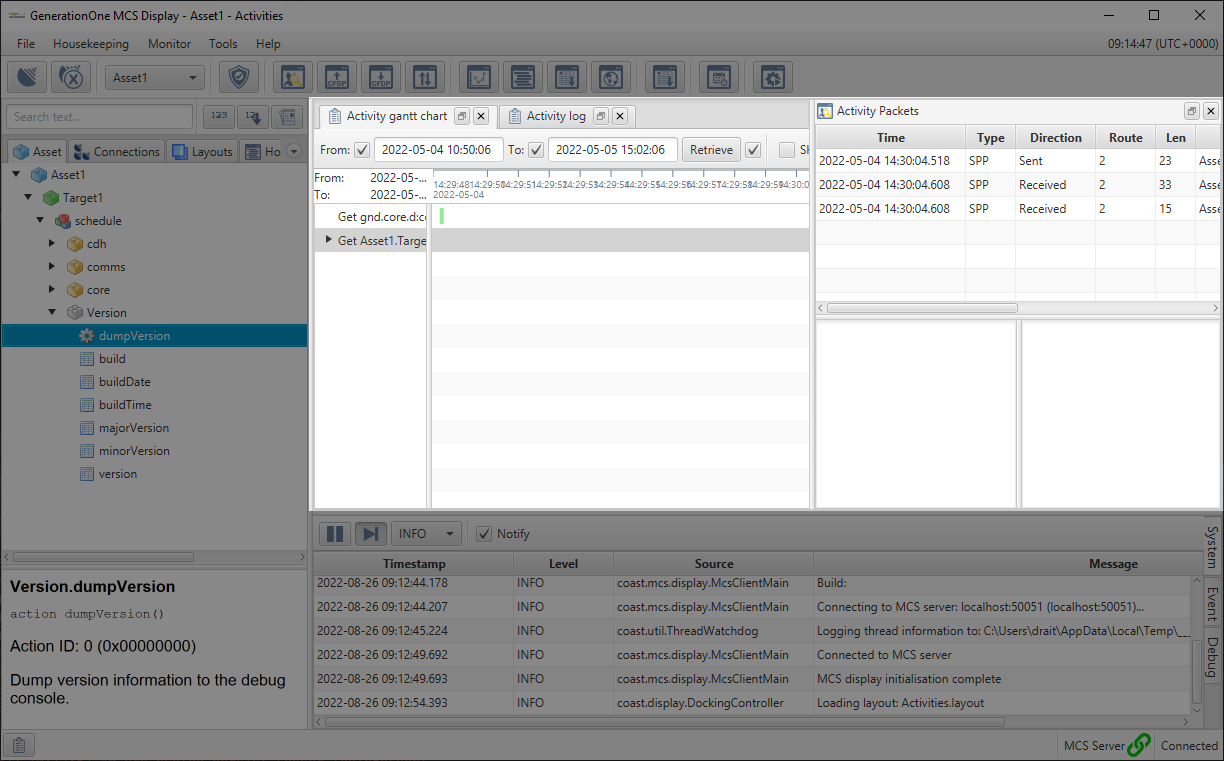
asset tab: This tab is initialised when spacecraft database are (SCDB) are loaded into MCS. It displays the Component structure of the currently-selected asset. It differentiates targets (marked in yellow) from Components (marked in grey). It uses icons to denote Actions (represented by a gear) and Parameters (depicted by a sheet). When MCS is connected to the asset, you can access the Parameter and Action dialogs by double-clicking on the respective icon.
-
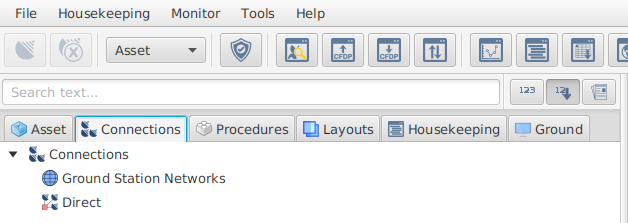
Connections tab: This tab shows the saved connection configurations. These may be for connections through third-party Ground Station Networks (GSN), or through direct connections. It includes direct, group, and multi-point connections.
-
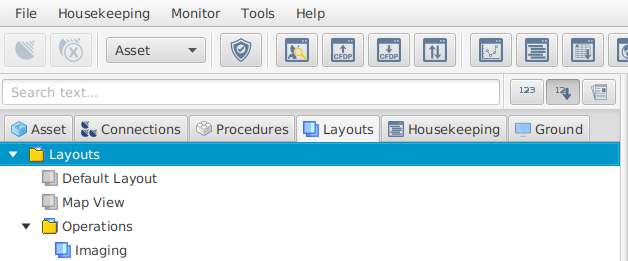
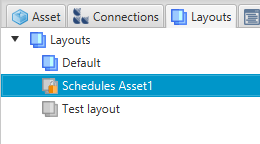
Layouts tab: This tab displays the saved layouts. Layouts store the current configuration of the user interface; allowing can to easily switch between custom GUIs.
-
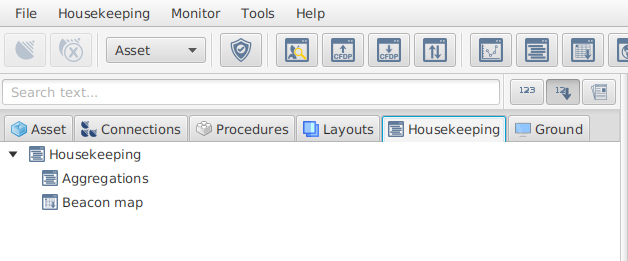
Housekeeping tab Shows the Housekeeping definitions currently associated with MCS. Housekeeping is comprised of Aggregations and beacon maps. Aggregations define data packages which are regularly received and decoded by MCS. Targets are Components that broadcast aggregated Parameters to MCS. The mapping specifies which Aggregation the spacecraft should send through each Target.
-
Ground tab Functionally similar to the Asset tab, but directed towards ground operations. It provides a detailed view of ground-based systems and operations; offering insights into the ground segment of Missions. It shows Parameters and Actions defined internally to MCS. It also displays details of current MCS client connections.
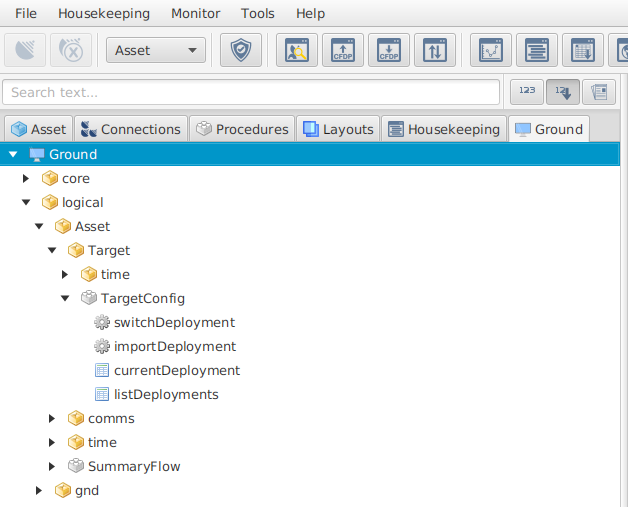
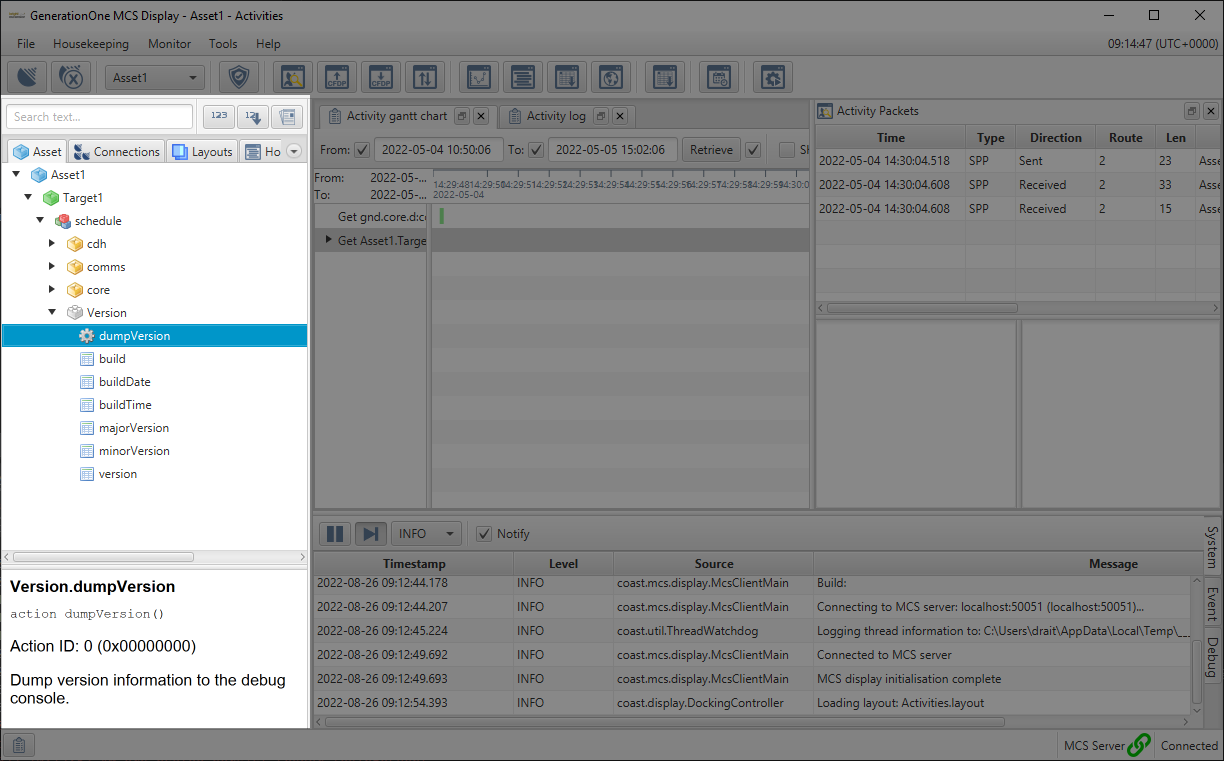
The bottom section of the mission explorer displays the documentation for the currently selected element. This includes the short name of the element, Action and Parameter IDs, and descriptions defined in the Component and Deployment models. Toggling the show documentation button will hide this section.
Docking area
The upper-right section of the GUI is the docking area. This is a configurable view that you can modify as needed. For example, you could add a windows that allows you to easily interact with Parameters, invoke Actions, see ongoing file transfers, or any other MCS dialog.
When you open a new dialog, it will float as a separate window. Windows can be added to the current layout by dragging and dropping them into one of the drop destination symbols in the docking area.
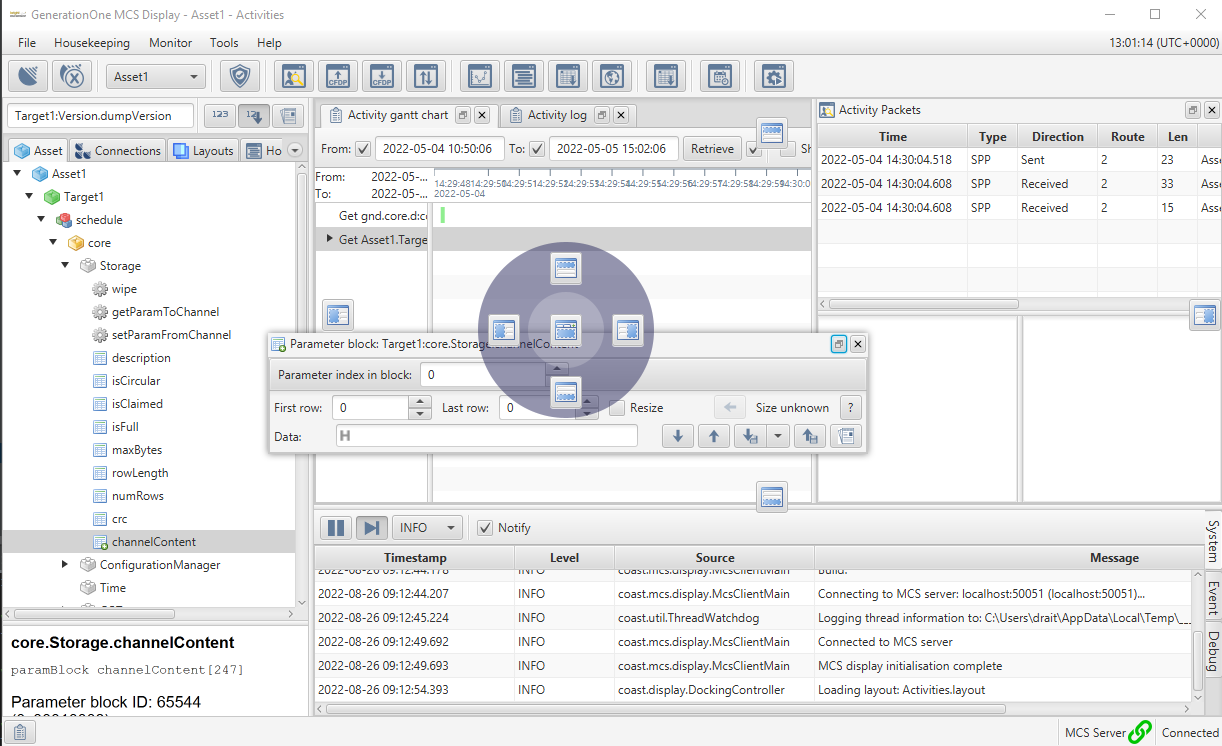
To create a split window, drag the dialog into one of the four drop destination symbols at the edges of the docking area.
Tab views can be created by dragging and dropping a window into the centre drop destination symbol.
To undock a window and turn it back into a floating window, drag the title bar of a docked view to anywhere on the screen or select the unmaximise button in the corner of the view.
Floating windows can be docked together to create floating windows using the same approach described above.
Layouts
Your layout is described by the current arrangement of windows, window sizes, docked panels, and values. When you initially load MCS, an empty layout is used by default. Changes to the layout are saved when MCS is closed or layouts are switched (assuming the current layout is not locked).
To create a new layout, open the Layouts in mission explorer and right-click the Layouts node. Select New Layout…, enter a name, and select OK. Changes can be saved by either right-clicking the layout and selecting Save, or by exiting MCS.
The Layouts tab in mission explorer shows the available layouts in MCS. Initially, this will just be the default layout. Layouts can be switched by double-clicking a layout. Layouts are saved before switching to a new one.
Locking Layouts
Layouts can be locked to stop further modifications - this can helpful if you want to create a template layout that shouldn’t be changed. To lock a layout, right-click a layout and select lock.
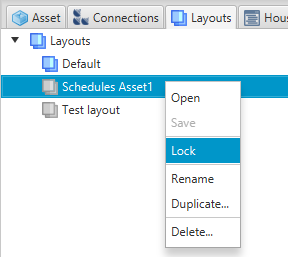
A padlock icon will be visible on the layout. This will prevent the layout from being modified.
Log view
At the bottom right of the MCS GUI is the log view. This is where System, Event, and Debug logs are displayed.

The log view displays logs from 3 sources, each displayed in their own tab:
-
System logs: logs originating from MCS rather than the onboard flight software (OBSW). These could be anything from connection failures to reports on how the ground schedule is being executed. If the behaviour of MCS is amiss, the first place to look would be the system logs.
-
Event logs: this tab shows Events generated by OBSW Components.
-
Debug logs: these logs show debug information specific to the OBSW. These logs should show data at a higher level of detail than event logs.Contains OBSW Component and source references. If something is going wrong with the OBSW, you should examine the debug logs to determine the cause of the problem.
The  pause button temporarily suspends updates to the current log view. Resuming will resynchronise any missing logs whilst it was paused and allow further updates to the log view. To ensure that updates are always visible, select the
  auto-scroll button. This will automatically display the latest entries in the log view.
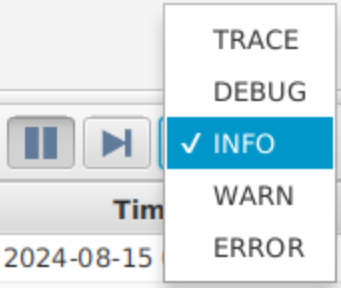
You can configure the log display level using the dropdown to the right of the auto-scroll button. This filters out logs which are below the selected severity level.
The image::ROOT:notify_checkbox.png[Notify Checkbox, width=30px] Notify checkbox will cause the relevant tab to flash whenever updates are made to the log. Unchecking this will disable notifications and display a small warning icon in the current tab.
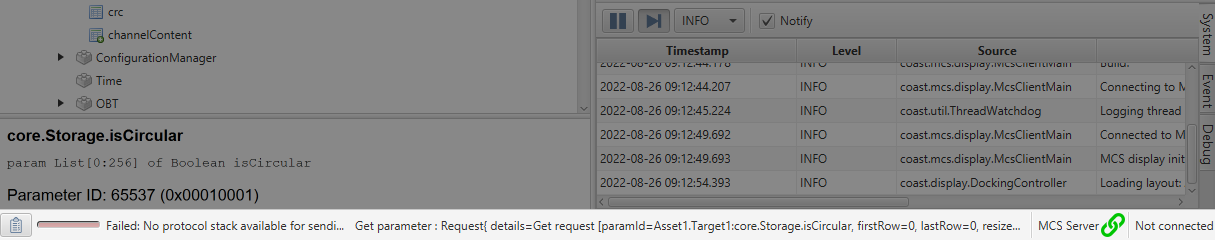
Status bar
The status bar at the bottom of the GUI displays the current status of tasks. This is only displayed while a task is active.
|
The status of completed tasks is available in the Active Tasks view, which can be opened using the image::ROOT:activities_button.png[Activities Button, width=30px] Activities button to the leftmost of the status bar. |
In the rightmost corner of the GUI, the status bar also displays the status of two connections: the MCS Display’s connection to the MCS Server, and the MCS Server’s connection to an asset. These will both show green symbols when connected.